Google Analytics Alternative

MARKETING

Analytics for Customer Engagement
MARKETING

Analytics for Customer Engagement

In March 2020, the world changed. And while some saw the beginning of the pandemic as the beginning of the apocalypse, others saw it as an opportunity to change their way of doing things. Change the way they shop, how they do research, and how they spend their downtime. And that makes sense, right? The rise of remote working has enabled more people to surf the internet and do their business online than ever before. Social isolation has also motivated many to improve their immediate surroundings by ordering products and homeware online. But that presents a challenge to business owners and webmasters. Are those customers finding what they’re searching for? Do they enjoy their browsing experience? Are they likely to return to or recommend your website to others when their session ends? ‍ Businesses need to analyze customer engagement and see if they can answer Yes! to these questions. Customer Engagement Analytics Customer engagement refers to the way that customers interact with a business. And tracking customer engagement in physical stores is relatively straightforward. You can set up structures that allow people to respond favorably when interacting with your brand. The right decor + Manage the air temperature inside the store + Service with a smile = Happy, returning customer. ‍ Source Pexels.com You can see how your customers respond to your product and their overall experience. This, in turn, tells you what you’re doing right and what you’re doing wrong. Tracking customer engagement for an online business might be less straightforward, but it is doable. ‍ Related article – Top Ecommerce Metrics to track in 2022 Customer Engagement Analytics allows businesses to put themselves in their customers’ shoes and think like the person visiting their website. Doing this allows them to envision the customer journey from beginning to end and adjust their product accordingly. ‍ Let’s look at 5 of the most important Customer Engagement metrics to track and why they’re essential to the longevity of your online business. The Net Promoter Score The Net Promoter Score or NPS has to do with long-term customer loyalty and the likelihood of those individuals returning to purchase your product or view your web pages again. An NPS is usually calculated using a single-question survey at various intervals during a customer journey. This gauges their satisfaction with your product or service. “On a scale of 1 – 10, how likely are you to recommend [Company name] to others?” That’s a typical example of a question you might have come across from which an NPS is calculated. ‍ Source Pexels.com‍‍ A score between 1 and 6 is regarded as negative, while scoring 7 or 8 is neutral.‍ In a net promoter score, you want your customer feedback to be either a 9 or a 10. This is considered a positive and the likelihood that the person will return or promote your brand to others is high. Why is this important? The higher the score, the more likely a company is to retain customers in the long run. ‍With the NPS, a company can make adjustments to improve the customer experience and monitor loyalty trends. This helps with your customer’s lifetime value. ‍A net promoter score also helps a business gauge how far ahead or behind they are in connection with their competition’s ability to retain customers.  Customer Satisfaction Score The customer satisfaction score, similar to the net promoter score, is calculated using a survey during the customer journey. ‍ “On a scale of 1 – 10, how satisfied are you with your purchase.” ‍But the key difference between these two scores is that the CTS gives you insights into the short-term satisfaction of your clients. In other words, are they satisfied with their product purchase or website experience? ‍ The scoring system is also formulated the same as the net promoter score. So you’re always aiming for your feedback to be either a 9 or a 10. ‍The higher the score, the higher your probability of customer retention. Why is this important? Knowing how satisfied your customers are on a short-term basis helps you to make real-time decisions. ‍For example, you can change how your checkout process works or pay more attention to the quality of your product to retain more customers if you notice a low score. ‍The customer satisfaction score also tells us a lot about customer behavior. That’s because we understand the likes or dislikes of website visitors with customer analytics. ‍Knowing how satisfied people are with your brand will help you engage them more effectively.  Customer Effort Score The third survey on our list is the customer effort score. ‍This score indicates the effort customers put into interacting with your company. It helps you understand some important factors that might need attention.‍ Is it easy to find your website? Are your web pages easy to navigate? Do the ads and pop-ups take away from the customer experience? Is the checkout process easy enough to encourage clients to follow through with their purchases? The reason why so many people choose to do their business online is that it makes life easier. ‍But the questions businesses need to ask are not only about the customer’s experience but also about the effort they put into making life easier for customers.‍ How much effort are we putting into solving issues for our customers? How much time do we dedicate to helping our customers make successful purchases? Are we investing our time and money wisely to create a user-friendly experience? Knowing the answers to these questions will help you make the shopping experience enjoyable for your customers and improve customer engagement. Why is this important? Suppose the layout of your website or factors like advertising pop-ups and forms take away from that experience. In that case, your customers will likely not have the patience to remain on your pages all the way to a successful checkout. ‍ Source Pexels‍  Churn The churn rate is the number of customers that stop interacting with your

Crazy Egg Vs Google Analytics
MARKETING

Crazy Egg Vs Google Analytics

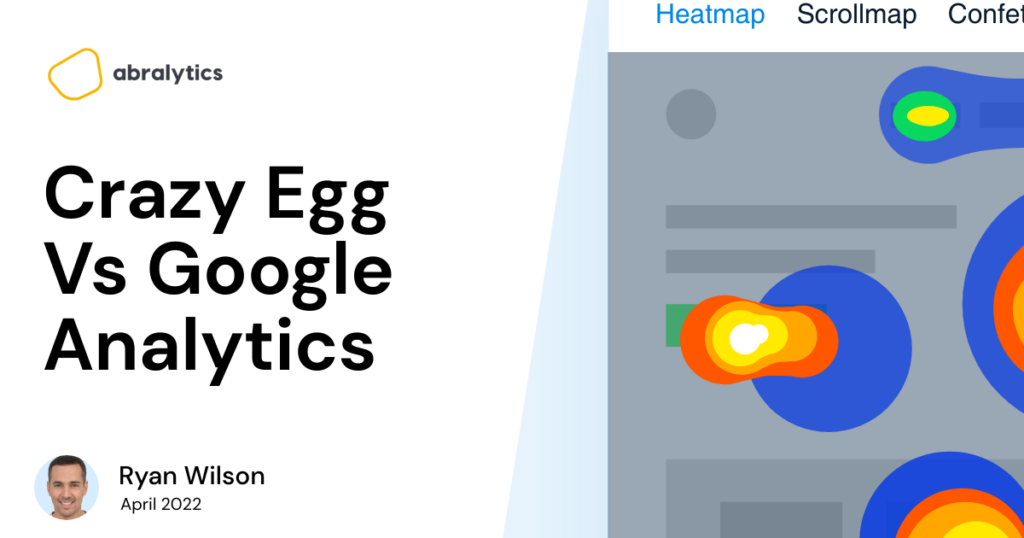
One of the most-effective ways to increase conversion on your website is to analyze your traffic sources and gain full insight into what users do on your website; the pages they navigate to, and how they proceed to either convert or drop off from your website. If you’re just beginning to optimize your web pages and you’re looking for the most-detailed Crazy Egg vs Google Analytics comparison, then read on. In this article, we will break down the differences between these two web analytics tools; their pricing model, features, limitations, integrations, pros and cons, and by the end of this comparison, you’ll discover the best between the two analytical tools for any use case. So, let’s get started with a basic question: what are Crazy Egg and Google Analytics used for? What Is Crazy Egg Used For? Crazy egg is a website analytical tool that gives you a visual representation of your visitors’ behaviour on your website using heat maps technology, scroll map tool, overlay reports, confetti and list reports so that you can boost conversion on your website. When you discover your visitors’ behaviour on your website, you can make use of the inbuilt A/B split testing tool to test different solutions. Crazy Egg answers the “why” your visitors aren’t converting, a report that most analytics software might not provide. What Is Google Analytics Used For? Google Analytics is generally a web analytical tool used for analyzing marketing campaigns across different channels, tracking campaign ROI, comparing the performances of different web pages, comparing the quality of visitors from different referrers, monitoring user behaviours, conversion rates, etc to determine how to drive more traffic and increase conversion. Now, understanding the similarities, yet distinct features of these two analytical tools will help any marketer identify which tool is right for the metrics they want to measure. The Core Differences Between Crazy Egg And Google Analytics While the two web analytics tools might have similar functionalities; basically used to track visitors, they have features that make them differ in so many ways, and we will start by looking at these core differences and what advantages each has over the other. Differences In Their Pricing Model Right off the bat, Google Analytics’ basic pricing is FREE for all users but has a recurring fee for advanced features according to ImpactPlus, which makes it one of the preferred web analytics tools for most businesses. On the other hand, Crazy Egg offers just a 30 Day free trial plan and a $24 monthly fee for its basic plan. Source: Crazy Egg pricing page‍ Heat Map, Scroll Map, And Overlay Tool In Web Analytics The heat map tool is one of the most powerful analytical advantages that Crazy Egg has over other analytical applications. Think about it, as a Digital Marketer, one of the biggest nightmares in conversion optimization is having to guess “why your leads aren’t converting”. Some analytics tools can only provide a generic insight of where visitors are dropping off from, as in the case of Google analytics, and there isn’t more to this. Source: Google Analytics path exploration page‍ While you might find it hard to zero in on the exact place of the page that turned your leads off, how far they scroll down your pages vs. how long they spend on your pages, Crazy egg will provide you with heatmaps of where your visitors are clicking on your pages so that you can decide what CTAs, links, that driving your conversion. Apart from the insights gotten from the heatmaps, you can determine what information is persuading your visitors to spend time on your page using scroll maps. The scroll maps tool shows how far down your visitors are scrolling and at the exact point they abandoned your page so that you can pinpoint where they lost interest, with this, you can add more compelling information to persuade them to spend more time on your page, or reposition your vital information. Source: Crazy Egg Website‍ What’s more appealing is that Crazy Egg has a great tool that gives you insight into how many clicks you are getting for each element on your page. To break this down, if you discover the search terms that drive traffic to your websites, you can narrow down your analysis and find out the elements that your site users are clicking on. So you see, arming your marketing team with such comprehensive information can help them discover optimization opportunities that can increase conversion on your site. Customer Satisfaction And Popularity Looking at the data from SimilaWeb, a digital intelligence provider for enterprise and small to mid-sized business customers, there’s a large gap between their numbers of visitors. Here are screenshots from Similarweb, comparing site traffic for Google Analytics and Crazy Egg. Google Analytics Traffic ‍Source: SimilarWeb Crazy Egg Traffic Source: SimilarWeb ‍ This data clarifies Google Analytics’ position as one of the favourite analytical tools compared to Crazy Egg despite being released a year after Google Analytics. Integrations One of the many features that marketers look out for when it comes to analytic tools is the pool of other marketing tools that permits mutual integrations. A website developed with WordPress CMS will certainly need SEO tools like Yoast SEO, page builders like Elemetor, hundreds of plugins, analytic tools, etc, and if there are limitations, marketers won’t hesitate to look for alternatives. Considering this, Google Analytics allows seamless integrations across a large number of marketing tools to foster user interaction more than Crazy Egg permits. Currently, there are just a few marketing tools that can be integrated with Crazy Egg, unlike Google Analytics which has hundreds of marketing tools that allow mutual integrations. Source: Crazy Egg Website‍ Talking about integrations, one of the best analytics platforms that provide mutual integration between major marketing tools is Abralytics. With Abralytics, you can integrate more than 100 marketing apps and custom sites. This is a great tool for marketers who are looking for simple analytics software. Available Support The

Do I need a Cookie Policy on my Website?
MARKETING

Do I need a Cookie Policy on my Website?

How you handle the personal data of visitors to your website can make or break their trust in your business. Today, there are more and more laws that govern how you collect and use personal information online. Cookie policies have become a controversial subject for website owners and visitors alike.  But can you do without a cookie policy on your website? If you are curious about the subject, then read on. This article covers everything you need to know about cookie policy — what it is, why you need it, and how to add it to your website. What Are Cookies? ‍ ‍Source: measureschool Cookies are small bits of data that websites create and store (as text files) when they load. Web browsers use these cookies to track user activity on a page. For example, it can save your password, so you don’t have to log into Instagram every time you want to access your account. So, you can think of a cookie as the short-term memory of a website. It stores the website’s URL, the cookie’s lifespan (or, if you prefer, its “use by”), and an individual ID for every user. Cookies can also show ads or offer a customized user experience. They enable a website to “recall” details between pages or visits stored in your browser. In addition, cookies store information that can be highly valuable, especially for users. It may keep track of user activity on the website, where they left off, customization preferences, log-in information, cart contents, and more. Types Of Cookies There are several types of cookies, just like in the real world. Based on lifespan, the two types of cookies are —session and persistent. Once you exit a website, a session cookie created in your browser’s cache is permanently deleted. On the other hand, persistent cookies enable websites to identify you when you return by staying in the browser’s cache for a specified period. Several types of cookies are used for data collection. They include: Analytical Cookies: These cookies anonymously track user activities on a website for internal research. But users can reject certain cookies. Operation Cookies: These cookies are crucial for a page’s performance; hence, they are not optional. Visitor Preference Cookies: These cookies record information about user cookie consent – whether or not a user accepts a cookie policy on a website. If so, these cookies keep track of that and stop further cookie pop-ups on that website. Are Cookies Harmful?   Source: martechcube‍ ‍ It depends on how you use them –  cookies may target ads or add users to marketing lists. Until recently though, most internet users didn’t know their online behavior was being tracked, But now that they do, it doesn’t sit right with them! Why Are Cookies Important To Website Owners? It should go without saying that a website using no cookies at all would be the exception rather than the rule. If you manage a small business website (or any business), think about this. For some context on the kind of functionality cookies enable, let’s quickly review some common uses for cookies: Tracking the carts/baskets of customers for e-commerce websites. Differentiating users in analytics tools like Google Analytics use cookies; Saving user preferences for website personalization, such as preferred language; Performing functions like user logins control and blog comments in Content Management Systems like WordPress; Social media marketing services such as targeted Facebook ads. First-Party Cookies Vs. Third-Party Cookies First-Party cookies are managed directly by website or app owners. Conversely, third-party cookies are handled by others, and it helps them offer their services. So, when your website or app uses third-party services to include features like photos, social media plugins, or ads – it features third-party cookies. What Is A Cookie Policy? ‍ Source: istockphoto‍ ‍ A cookie policy is a pop-up notification or banner that appears when website visitors access a page for the first time. It serves as a notice to users about the cookies active on the website, their function, and what happens to the data, including identifying third-party cookies. The cookie policy can come on a separate page or as a cookie consent banner that visitors can click to learn more about the data your website is collecting and sending to third parties. Laws from data regulation bodies, such as the European Data Protection Board and General Data Protection Regulation, state that website owners must get consent from visitors to collect or store data. With this, users are aware of how their data is collected, and they can manage cookies. Main Elements Of A Cookie Policy There are some specific pieces of information that you must include, regardless of whether you are writing a new cookie policy or expanding an old one. The following are the elements of a compliant cookie policy: Let visitors know that your website uses cookies. Add a sentence or two defining cookies. Mention the types of cookies you use. Indicate whether or not you use third-party cookies. Inform users of the purpose of your cookie use. Explain how visitors may opt-out of having cookies placed on their devices. What Are The Requirements For Cookie Policy? Creating a cookie policy for your website is a simple process. All you need to comply with cookie law are the three following actions: Determine What Cookies Your Website Uses And Their Function This can be done with a simple cookie audit or by scanning your website’s cookies using tools like CookieYes, OneTrust, etc. Let Your Website Visitors Know How You Intend To Use The Cookies This involves clearly stating how your website collects user data, processes, stores, and uses it online. Ask For User Consent You need to get visitors’ consent before using cookies or give them the option to decline for better control over their online privacy. Do I Need A Cookie Policy For My Website? You need a cookies privacy policy if you want to collect personal data on your website and your visitors are in the EU or

Event Tracking Explained
MARKETING

Event Tracking Explained

Every website talks. Before data analytics, we couldn’t hear the voices of our websites. But how do you know what your website is saying? Simple – Event tracking! Event tracking gives you a picture of how users engage with your website and business. Do you want to know more? Then, read on as we explore everything you need to know, including what it is, why you should track events, how to manage events data, and other relevant FAQs you may have. What Are Events In Google Analytics? Events are specific forms of user interactions with parts of a website that you can track in Google Analytics. For example:‍ Menus Buttons Videos Podcasts Gadgets External links Lightbox Scroll bar Images Forms, etc. ‍ Source: Pexels‍ ‍ Generally, users carry out actions on a website using a mouse, keyboard, form, or frame. So, the four types of events in Google Analytics are: Mouse Events Keyboard Events Form Events Frame Events ‍ Meanwhile, there are two categories of Google Analytics events: Events that result in pageviews when they occur: For example, a user clicks on a link to your blog (or any internal link) from your landing page. ‍ Events that do not result in pageviews when they occur: Examples of this include: File downloads Watching a video Log-ins Clicking an image Scrolling through a web page Loading pop-ups, light boxes, Ajax, JavaScript, and Flash contents What Is Google Analytics Event Tracking?‍ Event tracking in Google Analytics is tracking user interaction with elements of your website. Essentially, it monitors and records key user actions on your website. Google Analytics event tracking data includes: Total events and average events per session on your website Total events relating to events categories and individual events Session data, such as pages per session and session duration, for events and each event category E-commerce data like eCommerce conversion rate and average order value for events and event categories. Examples Of Event Tracking Reports In Google Analytics ‍ Source: Google Analytics Demo Event Overview Report The Overview report compiles vital event data, such as the overall number of events, top event categories, the number of events per session, etc. Top Event Report‍ You can switch between your event categories, actions, and labels in the Top Events report. This report is crucial for digging further into research on a specific event category. Event Pages Report‍ The Event Pages report displays the pages where events are triggered. In this section, we can examine the top pages that drive events. ‍ Events Flow Report The Events Flow Report shows you the order that viewers trigger events on your website. It shows you the path they take as they move from one event to the next and helps you to determine which content engages your audience the most. How Event Tracking Works ‍ Source: GA Sample Event ‍ Events in Google Analytics have four main elements. They are also a part of the event tracking code. Google Analytics uses these codes to track user interactions and group them into event reports. ‍ Here is how each of the four elements of event tracking affects your website: Events Category (mandatory): this is the title given to a group of events, such as videos, call-to-action buttons, e-commerce, etc. Event Action (mandatory): this is the type of user engagement you want to track, such as form button clicks, play button clicks, etc. Event Label (optional): this is a means to include extra details about specific website elements to define a special event, such as a product name, video title, or URL. Event Value (optional): refers to the process of giving an event a numerical value, such as a download time or a monetary amount. Setting Up Event Tracking From Your Google Analytics Account With Google Tag Manager Here is a step-by-step guide on how you can set up event tracking from your GA account so you can collect and analyze event data: Step 1: Choose The Parameters You Want To Track In Google Tag Manager To achieve this, carry out the following set of actions:‍ Go to the dashboard of your Google Tag Manager (GTM). Then, select “Variables” > “Configure”. A list of the parameters you can track on your website is on the right. Under Clicks, Forms, and Videos, double-check each parameter. After checking all necessary fields, you can click “X” to close the window and return to the Overview menu on the left. Step 2: Add A New Tag To Your Google Tag Manager ‍ The next set of actions are necessary to do this: As your tag type, choose Google Analytics: Universal Analytics by clicking on “Add a new tag.” Next, change the track type to Event. Step 3: Add A New Tag To Your Google Tag Manager‍ The components of the event category, action, label, and value play a role in this. By using the “+” button, you can manually fill out these fields or built-in variables. Meanwhile, you can specify whether or not to count a session containing this interaction as a bounce by using the ‘Non-interaction hit’ parameter. Important to note: If you choose “True,” GA will classify a session as a bounce when a visitor lands on a page, triggers the event (for instance, by submitting a contact form), and then leaves. Selecting “False” will prevent that session from being a bounce. If you haven’t done so, you may need to set up a variable in the Google Analytics Settings box. Click “New Variable…” if you can’t find one to choose. ‍ After this, enter your GA tracking ID in the Tracking ID field. Then click “Save.” ‍ Note: By selecting Admin in the bottom left corner, then Tracking Info (under Property) > Tracking Code, you can access your tracking ID in your Google Analytics account. Your ID will be on top of the screen. ‍ Step 4: Set Up Triggering Events To do this, follow the next series of actions: After configuring the fields, select the “Triggering” section.

Google Analytics page views by URL
MARKETING

Google Analytics page views by URL

Staring at data sheets can be overwhelming to some. Even blurry at times. ‍ We’re not all cut out to sit and stare at a screen, trying to figure out what the most important metrics are and what it all means in the greater scope of things. Thats why I created a simple, GA4 alternative. ‍ But page views by URL is an essential metric that you want to stay on top of. It allows you to see how many views specific pages have received. And the higher your website traffic, the more potential business you’re generating. ‍ Before we get into how you check page views with your Google Analytics account, let’s discuss the difference between page views and unique page views. What is a Page View in Google Analytics? Google defines it as “a view of a page on your site that is being tracked by the Analytics tracking code.” (1) That means that each time a website visitor refreshes or reloads after arriving at the site, the visit is counted as an additional view. A new pageview is also recorded if the user navigates away from the site and then returns later during the same session. In simple terms, although your analytics report will show you the number of page views, that won’t necessarily tell you how many individual users have visited your site. Many of these page views could be from one user browsing the internet. Ok, but how is a Unique Page view different? “A unique pageview, as seen in the Content Overview report, aggregates pageviews that are generated by the same user during the same session.” (2) That means if one person views a certain page multiple times during a single session, navigating away and back to that site, Google Analytics will continue to count it as one view in your Analytics Report. Thus, this is a more accurate way of tracking how many individual visitors have arrived on a particular page. Why is it important to understand the difference? As a business or website owner, you want to know how many users navigate your website’s pages. It’ll give you a clear indication if people are happy with your content or if you need to improve your site content to have better user engagement. To illustrate: A single user might be loading the same page over and over again, let’s say ten times. This means that he will generate a page view report of 10. But that doesn’t mean you have ten different visitors to your site. Unique page views are calculated in a completely different way. This means that even if that one user loaded a specific page 10 times, only one unique pageview would be counted. For this reason, page views will always outnumber unique page views. It’s important to keep in mind that your page views report in Google Analytics has more to do with measuring internal user behavior on your website than marketing or traffic acquisition. Understanding visitor behavior, especially with your landing pages, will help you make the needed changes to your website to bring success. There is also often a direct correlation between user interaction and revenue generated by your business. We can mainly categorize pages into two different categories, content and money. Content Pages Source: Pexels.com‍ As the name suggests, content pages lend users information about topics they are interested in. These are the types of pages visitors land on when researching a subject. An example of this could be a blog post or a product description on your website. Money Pages Source: Pexels.com‍ Money pages are the kind of website pages you can use to sell your product. They have call-to-action tabs embedded and ultimately bring you revenue. Examples of these are Product, Portfolio, and Service Pages. Show me how to check page views by URL Firstly, log in to your Google Analytics Account. ‍ On your Analytics Dashboard, navigate to Audience > Overview report From the Behaviour dropdown bar, select Site Content ‍ Here you’ll have the option of viewing the pages report of a Specific page, a Top-performing page, or All pages on your site. ‍ Select the desired pageviews report and it will pop up. As mentioned at the outset, data can be very complex and leave you scratching your head rather than leaping for joy. ‍ If so, you should consider creating a custom dashboard to display your data and metrics in an easy-to-understand way. ‍ “Google Analytics was too complicated. I save 2 hours every week with Abralytics.” Ryan McK – Founder of Subversive Design Agency Start your 30-day free trial No credit card required Cancel anytime ‍ Create a dashboard Although tables are helpful, they are often hard to understand in Google Analytics. Simple visualization helps us gain better insight. Set up a dashboard according to the information you want to understand most from your report in Google Analytics. If you set it up correctly, the data can be viewable in a single window or historical – Week by week, month by month, and so on. Too much going on? It’s often said that there is beauty in simplicity. ‍ Most people don’t want to sit and figure out how to view their own website traffic in complicated reports, let alone create a custom dashboard themselves. ‍ So, here’s a top tip: ‍ Abralytics has always been keen on simplifying things for the everyday user. And their approach to page views is no different. ‍ Apart from giving you a custom report, they set it up in an easy-to-understand way that displays Total page Views / Unique Visitors and Average Session Length, as seen below. ‍ Screenshot: Abralytics.com/demo‍ ‍ If you’re interested in slightly more in-depth reporting, showing on which days you generated the most traffic, you’ll have this custom dashboard available for viewing: ‍Screenshot: Abralytics.com/demo‍ So why not look at Abralytics as a real alternative to Google Analytics. Affordability and simplicity are perfectly balanced to give you the

Google Analytics - Paid vs Free
MARKETING

Google Analytics – Paid vs Free

‍ ‍”Free” is an enticing word, especially when it comes to tools that promise to enhance your business insights. But when we peel back the layers of Google Analytics, is it really as cost-free as it appears? Many users find themselves grappling with hidden expenses of Google Analytics 4—not just in monetary terms but also in time and complexity. The real cost of using Google Analytics often goes unnoticed until you’re deep into its setup and ongoing maintenance. From the hours spent learning its intricate system to the potential need for paid add-ons to reach deeper insights, what starts as a free tool can evolve into a significant investment. These hidden costs can take a toll, making you wonder if the price of “free” is too high. ‍ Exploring the Cost of Google Analytics and the Value of GA4 Alternatives While the allure of a “free” tool like Google Analytics can be strong, understanding what you actually get—and what you don’t—is crucial for making informed decisions about the analytics tools you choose to deploy. This post aims to peel back the layers of Google Analytics, revealing both its strengths and limitations, and introduce why a straightforward GA4 alternative like Abralytics might be the smarter choice for your needs. In this exploration, we will cover several key topics: What is Google Analytics? – A brief introduction to the tool and its core functionalities. Why do you need an analytics tool? – Discussing the importance of analytics in modern digital marketing. How does Google Analytics work? – Diving into the mechanics of how Google Analytics gathers and processes data. Pricing – Is Google Analytics free to use? – Unpacking the real costs associated with using Google Analytics. Is the Free version sufficient? – Evaluating whether the free version of Google Analytics meets the typical business’s needs. Key differences – Highlighting the major differences between the free and paid version of Google Analytics. Understanding data in GA4 – Explaining how data is handled in the latest iteration, Google Analytics 4. Why Abralytics is a good GA4 alternative – Introducing Abralytics and its benefits over GA4. Each of these sections will equip you with the knowledge to critically assess whether Google Analytics is the right tool for your business or whether a simpler, more transparent solution like Abralytics could better serve your needs. Stay tuned as we delve into these topics, starting with a comprehensive look at what Google Analytics is and why an analytics tool is indispensable in today’s digital landscape. ‍ What is Google Analytics? Google Analytics is a tool which allows you to track and monitor website traffic, as well as determine how well your website is performing. Once analyzed, it creates easy-to-read reports that you can use to make key decisions related to your digital marketing campaign. What information is provided in a report? Number of visitors to your site or your mobile apps Better insights into who your visitors are Which Google Ad directed them to your website Conversion rates, such as an online purchase or a sign-up to a newsletter User behavior such as session duration and pages per session. Track sales activity and performance on e-commerce sites Overall site performance, such as page-loading times Insight into which marketing channels are most effective, and much more Source: Photo by Timur Saglambilek from Pexels ‍ Why do you need an analytics tool? In the past, business owners were able to physically see their customers. Valuable information was gained by that simple meet and greet. You could tell what age group they fall into, their background, their likes and dislikes. Heck, you could tell how likely they were to return to your shop by the way they shut the door behind them. Source: Amina Filkins · Photography – Pexels ‍ But times have changed. Each day, more people are trading their shopping trolleys for mousepads. Familiar faces have become anonymous shoppers. Google Analytics is a tool that helps you understand who your digital customers are and provides deeper insights into how they behave. The reporting tools help you to assess which of your marketing campaigns are having the most impact. You can better understand which platforms are most popular with your customers and which ads are generating the most leads. This understanding helps you to put your money where your clicks are, so to speak. How does Google Analytics work? The first step is to create a Google Analytics account on google.com/analytics. Then, to get any data from your website into Google Analytics, you must place a global site tag on your site. This is known as your Google Analytics tracking code. The program will then start collecting data and compile reports made up of metrics and dimensions. Anything that can be measured with a number is a metric. For example, the number of visitors and the average time spent on the site. A dimension breaks the numbers into smaller segments, like the number of visitors directed to the site via Google ads or time spent on a specific page. ‍Source: Pixabay Pexel Pricing – Is Google Analytics free to use? Google Analytics (GA) comes both as a free and paid version, called Google Analytics 360 (GA360).  Small businesses can use the free service without paying a monthly charge, but if you want more advanced features, you will need to subscribe to Google 360 and pay a recurring fee. Is the Free version sufficient? For most companies, yes. The free version of Google Analytics is made for individuals, as well as small and medium companies. It provides the most important metrics which help you to make key decisions related to your digital marketing campaign. You’ll have just about everything you need to know about who your customers are and how they behave. At which point will you need to move to the paid version? The truth is, unless you’re a large enterprise using multiple tools to track your website activity, it’s unlikely you’ll ever need to upgrade. Photo by

Does Google Analytics slow down a Website?
MARKETING

Does Google Analytics slow down a Website?

As a Digital Marketer or business owner, there is no better feeling than having a website that functions at optimal speed. ‍ Site speed affects the user’s experience and your website’s key metrics – bounce rate, goal conversion rate, average time on page, etc. ‍ Many things can slow your site down, including large media files, the site’s CSS not being optimized, caching issues, and bulky site codes. ‍ But does Google Analytics slow down websites? ‍ Keep reading this article as we get you through everything you should know, including: ‍ How does Google Analytics work? How to test your website speed How to test script size Does Google Analytics slow down websites? Why you should care about your website speed. How can you improve site speed? How Does Google Analytics Work? ‍ Source: Google Analytics Dashboard‍ ‍ Google Analytics is a web analytics tool that collects user data from each website using page tags. Each page has a JavaScript page tag inserted into its code. ‍ This tag runs in each visitor’s browser while it collects data and sends it to one of Google’s data collection servers. ‍ Then, Google Analytics can create personalized reports to track and present web data such as bounce rates, goal conversion rates, number of users, average session duration, etc. ‍ Meanwhile, the page-tag collects visitor information by acting as a web bug or web beacon. However, because the system relies on cookies, it cannot collect data from users who have disabled them. ‍ What Is A Cookie? ‍ A cookie is a small .txt file that Google Analytics saves to a user’s browser cache, allowing it to identify your computer. ‍ Since the cookie’s value is different for every user, Google Analytics can use this cookie to identify a user who has previously visited your website. ‍ But how do I use Google Analytics for my website? ‍ So, to use Google Analytics for your website, you need to have a Google Analytics account and add a tracking code. ‍ What Is A Google Analytics Tracking Code? ‍ A tracking code tells Google Analytics that it needs to track your website visitors and any actions they take. It is built on a JavaScript program. ‍ Moreover, the tracking code will look at three vital sources of data and information. It uses: ‍ First-party cookies User’s web browsers and system information The browser’s HTTP request ‍ Hence, the Google Analytics tracking code gathers specific information about your website’s visitors from these data sources. ‍ Is Google Analytics Code Cached In The Browser? ‍ The straightforward answer to this question is YES. However, Google Analytics code is cached temporarily on the browser. ‍ So, what does this mean? ‍ Google Analytics cannot be cached in the browser for more than one hour by default. Hence, it must be loaded on each page rather than once when a new user visits a website. ‍ Moreover, Google Analytics scripts need updates from time to time, so Google does not offer long-term caching. ‍ Ultimately, this makes Google Analytics slow down your website – page load time. ‍ Meanwhile, if you want a perfect score on a Google page speed test tool like PageSpeed Insights or GTMetrics, you need to host google analytics locally – for long-term caching. How to test your website speed ‍ A great tool to measure your website performance is Google PageSpeed Insights. (1) ‍ To use the tool to test your site speed, here are the steps to take: ‍ First, enter your website URL on PageSpeed Insights’ website. Next, click on Analyze and wait for PSI to do the analysis. During the report generation process, the tool tracks the webpage field data in the CrUX – Chrome User Experience report. Then, it assesses the webpage performance with Lighthouse API. After reviewing the report, remove parameters that slow down the speed and lower the rankings. ‍ Also, note the color code for PSI reports below: ‍ Red shows poor website performance. Yellow means your website requires some level of improvement. Green indicates a good website performance. . ‍ What Is A Cache In Google Analytics? ‍ A cache enables faster access to often-used data without reloading each time it is accessed. Because caching is a background process, users are rarely aware of it. ‍ In Google Analytics, a cache contains a snapshot or saved copy of a website that Google servers and clients can access. When Google’s crawler analyzes a web page for indexing, it generates this copy. ‍ Pros Of Caching in Google Analytics ‍ First, it enables a fast response to search queries. Caching lessens users’ waiting time, eliminating their frustration and ultimately the bounce rate. ‍ Another vital role caching plays is allowing users to access locally unavailable documents. For example, if a website owner deletes their site, Google Cache saves it in Google’s server and provides backups of the latest version and the requested content. ‍ Cons Of Caching in Google Analytics ‍ The main drawback with caching is that when a web page is re-indexed, Google may fail to create a new snapshot. ‍ Similarly, the script size of your analytics solution impacts your website speed. The larger the script size, the slower your website. ‍ So, you need to know where your site speed stands with a Google page speed, too – fast or slow. ‍ How To Test The Script Size of Your Analytics Provider ‍ To test the script size of your analytics provider, you can use GTMetrics. (2) ‍ GTMetrics is a tool that tells you how well your website is performing. Besides, it has a feature called Waterfall Chart. ‍ Source: GTMetrics Waterfall Chart‍ ‍ The Waterfall Chart displays a request-based visualization of your website’s page load. Each element that loads on your site is highlighted, along with its size and timeline. ‍ You’ll see your CSS, images, other media elements, and JavaScript. So, you can determine which scripts from your