A Dimension in Google Analytics is an attribute or description of data.
Every report in google analytics is made up of Metrics and Dimensions. The dimensions of a report give you different attributes of the data you’ve collected.
For example, a dimension could be the City from which a set of metrics is taken in a report, like Istanbul, New York, or Paris.
A Dimension is different from a metric in that it doesn’t have any numerical value. It simply describes the data set, organizing numerical data into categories.
Studying the dimensions in your reports will help you better understand critical factors like where your website visitors are from, the language they speak, and the platforms or gadgets they use to navigate your website.
Primary Dimensions
When viewing only one of the default dimensions in Google Analytics, it is considered viewing a primary dimension.

Google Analytics Demo
In the example above, the primary dimension is the country from which a user started a session.
Although this data is valuable, it doesn’t tell you how the users found the website, or how long they viewed individual pages. But by layering different dimensions, you will get a more comprehensive picture.
Examples of default Google Analytics Dimensions include Gender, Age, City, Source / Medium, Keyword, Browser, Device Category, and Operating System.
Secondary Dimensions
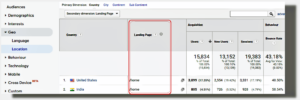
A secondary dimension gives you a more in-depth understanding of the primary dimension.
In the example used above, the primary dimension showed you where your audience originates from.
 Google Analytics Demo
The secondary dimension highlighted above tells you what the most popular landing page is (the page on which traffic enters your site). In this example, it is the homepage.
How to Create and View Secondary Dimensions
As secondary dimensions are already pre-defined by Google, you simply have to add them to your custom report to benefit from the metrics that go along with them.
- Step 1
In your Google Analytics report, you can view various dimensions on the left-hand drop-down bar.
In our example below the primary dimension is set to Language as part of the GEO funnel.
With this dimension, you’ll be able to see what language users prefer to view content in, as part of our Audience Overview Report. This is because Google Analytics records the Langauge settings in your users’ browser settings.
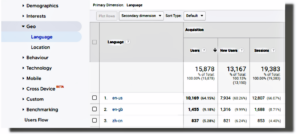
The dimensions in the example are the languages spoken by your audience: US English, British English, and Chinese.
The Metrics are grouped on the right under Users, New Users and Sessions Tabs. Note that metrics have a numerical value added to them.
- Step 2
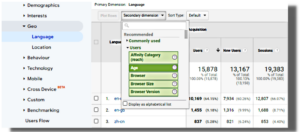
Once you’ve chosen the Primary dimension, you’ll be able to view possible secondary dimensions by selecting one from the drop-down list.
Predefined dimension funnels in Google Analytics include Acquisition, Advertising, Behaviour, and Users.
In the example shown we’ll use the Age dimension which is selected under the Users funnel
Google Analytics Demo
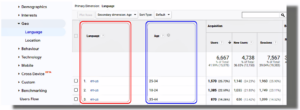
Now we’ll be able to view the age bracket of our users in the different language groups.
Google Analytics Demo
With a side-by-side view of two different dimensions, we get a better understanding of our audience.
But what if I need a secondary dimension, not available in standard Google Analytics reports?
That’s where Custom dimensions come in.
How to create and view Custom Dimensions
Custom dimensions, much like default dimensions, help you to layer information in a more in-depth way.
These custom reports go a long way in helping you understand your users better as you’re able to hone in on niche-specific data.
But there’s a catch to creating custom dimensions. The device category has to be enabled or alternatively, contain at least one app reporting view.
Custom dimensions also require additional setup in your Google Analytics Account and tracking code. You’ll only be able to view these dimensions after completing the setup process of both these steps.
- How to create a Custom Dimension:
Step 1 – Sign in to Google Analytics.
Step 2 – Click Admin, and navigate to the property to which you want to add custom dimensions.
Step 3 – In the Property column, click Custom Definitions > Custom Dimensions.
Step 4 – Click New Custom Dimension.
Step 5 – Add a Name. This can be any string, but use something unique so it’s not confused with any other dimension or metric in your reports.
Step 6 – Select the Scope. Choose to track at the Hit, Session, User, or Product level.
Step 7 – Check the Active box to start collecting data and see the dimension in your reports right away. To create the dimension but have it remain inactive, uncheck the box.
Step 8 – Click Create.
- How to View Custom Dimensions in Google Analytics
- Step 1
After signing in to your Google Analytics account, you’ll be able to view different dimensions on the left-hand drop-down menu.
Let’s use the same example with the primary dimension set to Language as part of the GEO funnel.
- Step 2
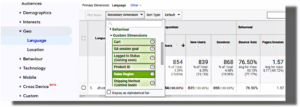
Rather than select one of the predefined dimensions, scroll down to Custom Dimensions. The dimensions that you’ve set up in the 8-step process to create custom dimensions will appear here.
In the example, we chose the Sales region as the Custom Dimension.
Google Analytics Demo
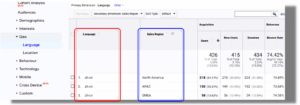
Now you’ll be able to view this custom dimension (in blue) alongside one of the standard dimensions (in red) that you already have selected, as depicted below.
Google Analytics Demo
This custom dimension helps you understand in which sales region a particular product is most popular.
What is the difference between Dimensions and metrics?
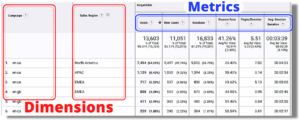
In all Google Analytics Reports, Metrics are quantitative measurements and Dimensions are the labels used to describe them.
Google Analytics Demo
To put it simply, Metrics are always expressed by numbers (number values, %, $, time), while Dimensions are expressed by non-numerical values such as Geographical locations, Gender, products, etc.
Have a look at this article if you want a better understanding of what Google Analytics Metrics are.
Examples Google Analytics Dimensions
Each dimension in Google Analytics falls into a different category. Here are just a few of the most popular ones:
- Source/Medium Dimensions
Source is where your traffic originates from. For example, Facebook, Google, Bing, or Yahoo.
While Medium is the group or type of traffic. For example, CPC, organic, email and web referrals.
The Source/Medium dimension is a combination of the two.
- Campaign
The campaign dimension either refers to the Google AdWords names or the names of the UTM campaigns for custom marketing campaign tracking.
- Page
The page dimension refers to the URL of the page that is being viewed.
- Products
The product dimension is a metric that has product-level scope. For example, product, product SKU, product category, product brand, product list name, and transaction ID.
- Browser
The browser dimension is the viewport size of the browsers of a user. The browser size displays the viewport dimensions in pixels and the formatting in terms of height * width.
- Country
Google Analytics reports offer several geographical dimensions, such as a Continent, Subcontinent, Country, and city.
- Language
The language metric refers to the language of the user visiting the website. Google Analytics depends on the user going to the device settings to change to a specific language in order to track this dimension.
- Device Category
Refers to the device from which the user is visiting the website, such as a desktop, laptop, or mobile device.
If you enjoy learning more about different features of Google Analytics, why not check out these informative Abralytics Blog posts:
What are Active Users in Google Analytics?
How to Measure Website Traffic?
Does Google Analytics Slow down a Website?
Source:
1- Google Analytics Bounce Rate


