There are literally hundreds of metrics you can track on Google Analytics. However, not all of them are crucial to your website performance.
So, it is vital to separate the wheat from the chaff.
Are you wondering what the most important Google Analytics metrics are? Then, read on.
This article covers everything you need to know about the most important metrics to track on Google Analytics, how they affect your website and why you should monitor them.
What Is A Metric In Google Analytics?

Source: Unsplash
A metric is a numerical value assigned to show how a website performs relating to a specific dimension.
So, a metric is a quantitative measure of data expressed in percent (%), Dollars ($), time, and numbers.
For example, the bounce rate of a page is the ratio of the number of bounces (single-page sessions) to the total session number.
As mentioned, there are literally hundreds of metrics and dimensions on Google Analytics that tell you about your website performance.
As a digital marketer or business owner, you need to keep an eye on the most critical metrics to gain insight into what works or not in your marketing funnel.
Ultimately, these metrics paired with dimensions can help you see what you need to tweak for the success of your marketing campaigns.
What Are Dimensions In Google Analytics?
Dimensions are a description or characteristics of an aspect of your website data. They provide information about the attributes of your website visitors.
For example, instead of measuring just users (metrics), you can measure users by gender (dimension) or user by location (dimension).
In most analytics report tables, dimension data are the rows and metrics data are the columns.
Both metrics and dimensions work together to give you comprehensive information about your website, who your users are, and how they discovered your content.
Top 10 Most Important Google Analytics Metrics
Without further ado, here are the ten most essential Google Analytics metrics to track for any industry:
1. Users
Source: Google Analytics dashboard
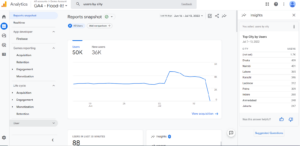
In Google Analytics, users are people who start a session on your website.
You can use this metric to determine whether or not you’re attracting the right kind of visitors based on the type of website you run and your objectives.
You can assess the Users metric under Audience > Overview.
The Overview Section also includes information like new users, sessions, number of sessions per user, page views, pages per session, average session duration, bounce rate, etc.
There are two categories of users – new users and returning visitors.
What Are New Users vs. Returning Users?
Source: Google Analytics dashboard
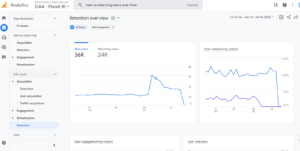
New users are people who visit your site for the first time. On the other hand, returning users are visitors who have previously started a session on your website.
How does Google Analytics differentiate between new and returning users?
Google Analytics uses cookies to differentiate user data. It uses a tool called Google Tracking Snippet to check for the tracking code (cookie) on the browser of your site visitors.
For new users, the cookie will not be present. But the cookie will be there for returning users.
It is important to remember that the “User” metric on Google Analytics is not 100% accurate.
The analytics tool counts the same user as separate users if they visit a website using different devices or browsers, erase or disable cookies, or switch to Incognito or Private browsing.
2. Sessions
 Source: ppcexpo.com
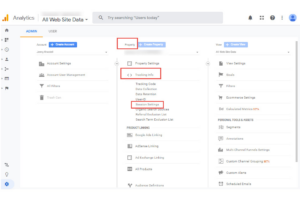
 A session is how much time users spend interacting with your site and what they do when they’re there.
For example, a single session may include several website visits, events, social interactions, and eCommerce purchases.
Moreover, a user can open more than one session. These sessions can happen all on one day or spread out over a few days, weeks, or even months. As soon as a session closes, the user can start another.
How Long Does A Session Last?
There are two determiners of the duration of a session – time and campaign change.
- Time-based Expiration
A session expires after 30 minutes of inactivity by default, but you may change this time frame so that it can last from a few seconds to many hours.
Also, every session ends by midnight. So, if a user opens your website at 11:50 pm on July 7 and engages with your site till 12:15 am on July 8, Google Analytics counts the number of sessions as 2. This is because the first session ended at midnight on July 7, and the second session started on July 8.
- Campaign Change
Google Analytics starts a new session each time a user’s campaign provider changes. Meanwhile, a campaign is any traffic source that brings users to your website – ads, search engines, social media, etc.
So, an existing session ends when a user leaves your website via one campaign and enters using another.
What Is Average Session Duration?
The Average Session Duration tells you how long visitors spend on your website on average. Google Analytics starts tracking a session as soon as a user enters your website and keeps track until the session is over.
3. Source/Medium And Channels
The Source metric tells you from which channel users visit your website.
On the other hand, the Medium metric represents the broad category of user access methods, such as organic traffic, pay-per-click (PPC), etc.
Also, the Channels metric is a group of traffic sources that use the same medium, such as Organic Search, Direct, Social, Paid Search, Email, etc.
Overall Traffic and Traffic Sources
Source: monsterinsights.com
Website traffic is the total number of people that visit your website within a specific time.
And traffic sources give an account of how users found your website. They help to understand your audience and where to channel your marketing efforts.
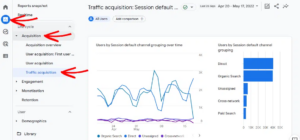
If you want to see the traffic sources report from your Google Analytics account, navigate to Reports » Acquisition » Traffic Acquisition.
How Google Analytic’s Groups Traffic Sources
In Google Analytics, traffic sources fall into one of the following channels:
- Direct
Users that enter your website’s URL directly or click on a link in an email, PDF, or stored bookmark. Any traffic for which Google does not know the source information also belongs here.
- Display
Display source accounts for users from paid advertising such as banner ads. So, if a new visitor clicks on a link to your website on your ad, the traffic belongs here.
Email sources are traffic that your website generates via email links. An example is when you send a newsletter to your customers, and they click a link that brings them to your website.
- Organic Search
Organic search traffic happens when a visitor finds your website using a search engine such as Google, Yahoo, or Bing. Visitors find your site in search results, not from paid ads.
- Paid Search
Paid search accounts for users that visit your website via a link from a paid search engine like Google Adwords, etc.
- Referral
Referrals account for visitors to your site that come from another site. For example, if someone clicks on your link from an affiliated website.
- Social
Social source accounts for visitors that click on a link via any main social channel like Facebook, Twitter, Instagram, etc.

Source: Pexels
4. Pages Per Session
Page per Session is the number of your site’s pages a visitor opens in one session. So, a rise in the Pages per Session metric could mean your content keeps the user engaged because they are navigating to more pages.
When developing and evaluating your site’s page strategy, ensure each page has links for users to navigate elsewhere on the site.
Consider your website a guide to help people with the information they need, creating trust, boosting credibility, and encouraging conversions.
In Google Analytics, the Pages per Session metric is expressed as the ratio of page views to the total session number. For example, if your website has a value of 5 for its Page per Session metric. This implies that an average visitor opens five pages of your website before leaving.
To track the page per session metric, navigate to Audience > Overview. It is on the left side of the menu.
How To Visualize Pages Per Session
In Google Analytics, the default view for Pages per Session is a summary chart, metric view, or KPI view. It gives you an overall snapshot of your Pages per Session as a single number. You may also compare the present value to a previous period to see how trends change.
If you segment your data, let’s say, by user groups (device type, age group, traffic source, etc.), you can also present your Pages per Session in a bar chart.
5. Devices
In Google Analytics, the Devices metric shows the number of users that access your website via desktop, mobile, and tablet devices.
While it’s necessary to assess both mobile and desktop website experiences, the devices metric is crucial since it helps you decide whether to focus all your efforts on one.
For example, you may want to improve your website’s desktop interface, but it turns out that most traffic comes from mobile devices or the other way around.
So, understanding the Devices metric can help you locate where to channel your marketing efforts.
Comparing Desktop vs. Mobile vs. Tablet Devices
In Google Analytics, navigate to the “Reporting” page, then Audience > Mobile > Overview to see an overview of the various device types.
The mobile overview report shows you how the device types compare. Usually, mobile and tablet devices have the most traffic but convert at a lesser rate. Of course, each site’s Devices metric varies, so you’ll have to do your research.
6. Average Time On Page
Source: help.analyticsedge.com
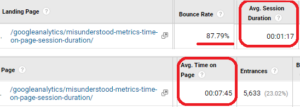
The Average Time on Page shows you the time a user spends on a specific page of your site. You can tell how engaged users are with your site content by average looking at how long they stay on a page. For instance, users will stay longer on a blog post than on a signup page.
However, if a page has a low average time on page, you can boost engagement by integrating multimedia content like videos.
In math terms, it is the ratio of the overall number of sessions to the total time of all sessions (measured in seconds).
The average time on your page is not the same as your average session duration.
In its report, average session duration includes bounces and exit pages, whereas average time on page tracks non-exits and non-bounce sessions only.
How Google Analytics Track Average Time On Page
By comparing the timestamps of hits, Google Analytics measures time on page and time on site. It records no time if the visit is a bounce. So, a user who leaves your website from the landing page without engaging your content or clicking on any internal links will not count.
Even when the browser is closed, Google Analytics continues to track how long users spend on a website. Also, Google Analytics logs the total amount of time a user spends on each tab if you have more than one open tab.

Source: Pexels
7. Pageviews And Unique Pageviews
The pageviews metric in Google Analytics is the overall count of views per page for your website. When a user visits a page more than once, additional page views are recorded.
However, the unique pageviews metric accounts for the number of times a user visits the same page per session.
If a user visits the same page more than once within a single session, Google Analytics will only count that as one unique pageview.
Pageviews vs. Unique Pageviews
Pageviews and unique pageviews are two different metrics.
Unique pageviews aggregate all pageviews from the same user on the same page and during the same session and count them as a single event.
Even if a user visits the same page ten times and refreshes it many times, but all of the views occur in the same session, Google counts it as one unique pageview.
To understand how Google counts both metrics, here are some scenarios for pageviews and unique pageviews:
- Currently, your visit to this page counts as one pageview.
- The pageviews will increase to two if you reload this particular page, but only one unique pageview will occur.
- It becomes three pageviews and two unique pageviews if you share the link with a friend, who then visits it (thanks).
- Tomorrow, if you open this page in a different session, we will have four pageviews and three unique pageviews.
How To Find Pageviews And Unique Pageviews On Google Analytics
Visit the Behavior > Overview area of Google Analytics to see the total pageviews and the number of unique pageviews.
Also, check Behavior > Site Content > All Pages to examine your website’s most popular pages.
8. Landing Pages
Source: omisdo.com
A landing page in Google Analytics is the first page users see when they visit your website.
Therefore, it might be —your homepage, a blog post, a product page, a support page, a sign-up page, or anything else.
The landing page of your website has a vital role in how high your website ranks on search engine organic results and whether consumers will exit or continue to another page of your website.
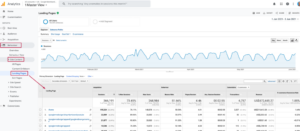
In Google Analytics, the landing page report shows how much traffic the first page of users’ sessions generates.
To view your website’s most popular landing pages, visit Behavior > Site Content > Landing Pages.
Landing Pages Vs. Exit Pages
Landing pages and exit pages are like the two sides of a coin. While tracking your website’s landing pages is vital, you should also keep an eye on the exit pages.
An exit page is the last page a user visits before leaving your website. Similar to a landing page, an exit page could be any page of your website.
Why Should You Track The Landing Pages Metric?
The landing page report is essential to your web analytics since it helps you see which pages drive traffic to and promote conversion on your website.
The landing page report informs you of how users find your content. With this information, you can decide whether you need to develop or improve other landing pages for a better result.
9. Goals/ Conversion
Every website must have at least one goal. In Google Analytics, a goal is an intended action for visitors, such as sign-ups, purchases, add-to-cart, reading an article, etc.
A Conversion happens when your website user performs one of the target actions or completes a goal.
Google doesn’t come with conversions or goals already set up because the metrics are custom and vary from one website to another.
Both goals and conversion are unified by – the goal conversion rate. Goal conversion rate is the percentage of the number of completed goals to the total session number. Essentially, it tells you how many target actions your users perform.
How To Track Goals/Conversion In Google Analytics
Source: monsterinsights.com
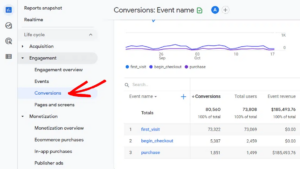
You may label existing events as conversions in Google Analytics 4 by:
- Click Configure » Events in the navigation bar on the left.
- Look for the event in the Existing events table.
- To turn on the switch, click in the event’s Mark as conversion column.
You must determine what makes a goal for your website in Universal Analytics before asking Google Analytics to include it.
Source: monsterinsights.com
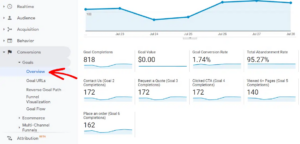
This report enables you to access your website’s overall performance.
Go to Conversions » Goals to see the report on conversions.
10. Bounce Rate
Source: hotjar.com
A bounce is a single-page session. It happens when a user lands on a page and does nothing else.
So, the website user does not send any requests to the Google Analytics server before exiting the page.
For example, a user visits your website’s landing page from one of your social media posts and does not click on any of your internal links or engage with your content. Then, Google Analytics counts the user activity as a bounce.
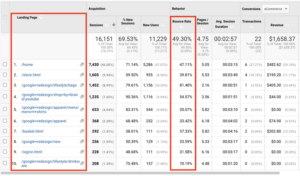
In Google Analytics, the bounce rate shows the number of sessions that result in a bounce. Invariably, it tells you how often sessions begin and end on the same page.
Mathematically, bounce rate is the ratio of total bounces to the total session number.
Good Or Bad Bounce Rate?
Depending on the page, a bounce rate may be good or bad. For example, when a page’s goal is to direct visitors to other parts of the website, a high bounce rate (over 70%) could mean you should improve your landing pages.
In Google Analytics, navigate to Audience > Overview to see your website’s total bounce rate.
By selecting Behavior > Site Content > All Pages, you can also view the bounce rates for specific pages.
Why Should You Track The Bounce Rate Metric?
The bounce rate tells you how many users leave your website from the landing pages. Using this information, you may decide if you should invest resources in creating a new page or improving an existing one for users.
In addition, bounce rate by browser shows how well your website performs on a browser. If your website has problems with browsers or browser versions, it will reduce your total conversion rate and the time consumers spend on your page.
Final Verdict
In summary, Google Analytics is the most popular website analytics tool. It offers hundreds of metric reports to help you assess how your website’s performance.
To make life easier, we have discussed the top ten must-track metrics for every industry. Pay close attention to each when you next check your analytics report.
However, if you want an analytics solution that saves you from navigating through unnecessary information to get what you really need, opt for Abralytics.
If you found this article helpful, check out similar Analytics articles on Abralytics.
Other related articles
- What are active users in Google Analytics?
- The most important KPIs to track on Google Analytics
- How to track button clicks on Google Analytics

![10 Most Important Google Analytics Metrics [2022]](https://abralytics.com/wp-content/uploads/2025/03/Fdc244c620.png)


