Today, there are many analytics tools, each sporting a list of impressive features. But it’s not always easy to figure out which of these your business really needs. So how do you choose the right tools for your business? The Abralytics team is here to help!
We think life is complicated enough and finding the right tools to help you run a stellar website shouldn’t be.
An analytics tool helps you “analyze” your website or mobile app. Some tools help you with more technical aspects like page loading speeds and site maps, others tell you more about your customers and how they engage with your site, and some even help you fill your page content with all the right words to rank well in search.
Today, we’ll discuss two well-known and respected analytics tools, Matomo and Hotjar. What do these two platforms offer that makes them worthy of your consideration?
Hotjar in a nutshell
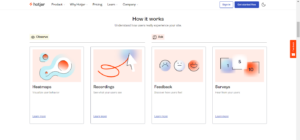
Hotjar is a UX tool focused on helping you create a great user experience on your website or mobile app. Its features fall into two main categories, namely, Observe and Ask.
Observe: Visualise what a visitor does on your website from the first to the last click. User behavior is observed using heatmaps and session recordings. We’ll delve deeper into these incredible features in a bit.
Ask: How helpful would it be if you could talk directly to your online customers like we did in the past with a traditional store? Now you can with Hotjar’s Feedback and Survey tools.
Hotjar is not a traditional website analytics tool like Google Analytics, which gathers data in the form of reports. If you find it challenging to turn reports into meaningful insights, Hotjar is perfect for you! No guesswork, just a clear customer journey right before your eyes. However, Hotjar does recommend running its platform alongside an analytics program to get the most comprehensive insights.
 Source: Hotjar
Matomo in a nutshell
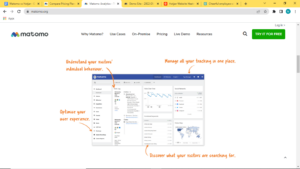
Matomo is both a UX and web analytics tool rolled into one. The clear advantage of Matomo over Hotjar is you can run both from a single place instead of using two different platforms.
It has similar UX features to Hotjar, like heatmaps and session recordings, as well as a host of analytics tools. How does it compare to Google Analytics? See our blog section for an in-depth article, but here are a few key advantages of choosing Matomo over Google Analytics:
- With Matomo, you have 100% ownership of all data.
- No data sampling or limitations
- The ability to import GA data. For now, it’s not possible to import data from Universal GA to the new GA4 platform. When you switch over, data will be collected from scratch, meaning you’ll lose all the historical data you’ve collected. Matomo allows you to import all your data from UA – that’s a big plus.
Source: Matomo
What about a little thing called data protection?
If recording a user’s session or movements sounds a little suspicious to you in terms of data protection, have no fear. Both platforms are fully GDPR (General Data Protection Regulation) and CCPA compliant.
With Matomo, you are given 100% ownership of data and a guarantee that it won’t be used for marketing or other purposes.
Both platforms collect data about a person’s interaction on your site and use it to create a visual representation of their journey. All of this is possible without tracking a personal IP address or needing to collect personal data.
Heatmaps & Session Recordings
Both Hotjar and Matomo offer heatmaps and session recording tools.
Heatmaps help you see exactly where visitors click on a page, their movements, and how far they scrolled down. The more an area has been clicked on, it will gradually move from being highlighted in green to red. This is known as a “hotspot.”
Both platforms give you these three options: Click; Move; Scroll; And both allow you to switch between desktop, tablet, or mobile heatmaps.

Source: Hotjar
To the left is a scroll heatmap, and to the right, a click heatmap on the Hotjar platform.
Session Recordings are videos of a visitor’s journey on your website. Like heatmaps, they also show you where users clicked, scrolled, or left your site.
Benefits of heatmaps and session recordings
- It helps you see which areas of your site are popular and which are largely ignored. Are users seeing important content and using main links such as CTA’s?
- Clearly shows you at which point a user left your site. This can help you identify an element of your site that frustrates users or indicates which content needs a CTA or more engaging content.
- See how far a user scrolled down on a page. This can indicate which pages may be too long or don’t hold the user’s interest for long enough.
- Compare a site’s performance across devices: Desktop, tablet, and mobile.
- User recordings help you spot elements of your site that aren’t performing as they should, such as broken links or tabs.
Additional features offered by Hotjar
You can also purchase “Ask” features with Hotjar, namely Feedback and Surveys.
Feedback enables you to simply ask visitors about their online experience in real-time. It appears as a tab at the side of your site’s pages, so if a user expresses frustration or happiness, you know exactly which page caused them to feel that way. Collecting user feedback helps you to turn more visitors into customers.

Source: Hotjar
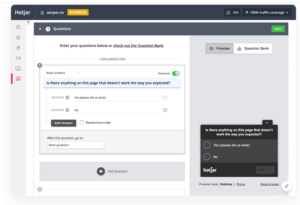
Surveys help you get valuable suggestions or comments from website visitors, giving you a platform to ask the right questions at the right time. Hotjar makes this process really simple by providing pre-built templates and a handy question bank. In a few minutes, you can set up a survey to ask visitors what caused them to leave your site or ask for suggestions on how to improve your service or product.
Source: Hotjar
Additional features offered by Matomo
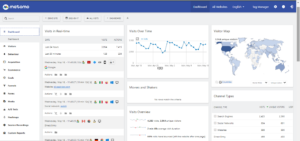
Source: Matomo
As mentioned, Matomo also comes with a host of web analytics tools. Matomo analytics includes all the standard reports and analytics data you’d expect to find, as well as these nifty features:
- Get a complete list of keywords that caused your site’s pages to appear in search.
- Choose from over 200 dimensions and metrics to create customized reports.
- Track SEO web vitals like your website’s page loading speed
- GDPR Manager to ensure your site is fully compliant
- Form analytics helps you improve form submission rates. If your forms are too long, too complicated, or not optimized for mobile visitors, Matom’s form analytics o will help you figure it out.
- Media analytics gives you insights into how well your videos are performing. Are they being watched, for how long and on which platform?
Matomo analytics is focused on privacy and can be configured to meet even the strictest data protection laws. It’s also open-source software, meaning it’s continually reviewed to ensure your data is kept safe.
Pricing comparison

Source: Pexel.com
With Hotjar, you purchase Observe and Ask features separately and the cost increases with the number of sessions. You can get free basic versions of both categories; paid versions start at 31 Euros for Observe and 47 Euros a month for the Ask features. See Hotjar’s pricing plans here.
Matomo analytics can either be hosted on your own server or hosted by Matomo. The self-hosted service is free with more advanced features priced individually and requires technical knowledge and a server. The hosted version starts at 19 Euros a month and increases with the number of hits and monthly traffic. To compare all pricing plans, click here.
Conclusion

Source: Pexel.com
Both Matomo and Hotjar are exciting tools to help you create a fantastic user experience every time a user lands on your page. Of course, it’s not just about creating the best experience. Good experiences turn into conversions and paying customers, which are essential for a successful business.
If you’re looking for a tool focused on UX, Hotjar is your platform. But if you would like to combine these features with traditional web analytics, consider using Matomo.
And if you’re looking for a straightforward web analytics platform to pair with Hotjar, consider using Abralytics. Abralytics focuses on providing all the essential data and reports in the most easy-to-understand format and language. Get your 30-day free trial here.


